
On December 24, 2021, with Bitcoin trading near $51,000, PlanB began a post with “Let me be clear:” and quoted a test he had once set for his own model.
PlanB (tweet, December 24, 2021, 3:08:55 PM UTC)
- Dec100K miss: I have said earlier that if BTC<$100K Dec2021, then S2F is “off the rails” “invalidated” “dead”. Tbh that was an ill attempt to clarify “$100K average this cycle” & regression analysis. S2F MODEL INTACT
Eighteen seconds later he posted the test that replaced it.
PlanB (tweet, December 24, 2021, 3:09:13 PM UTC)If BTC stays within 1sd band for the next 2.5 yrs, then S2F model is still valid and indeed useful for me.
The first test had a month and a number. The second had a band about $150,000 wide and a window of thirty months. Same model, eighteen seconds apart, two different ways of being wrong. Every Bitcoin price model carries a test like this, whether its author wrote one down or not, and the tests are not alike. A dated target is checked on its date. A corridor is checked over the years it spans. A curve with an arrival table is checked on the days in the table. So the first thing to read in any of these models is the promise, in the words of the person who drew it. In more than one place, the promise in the record is not the one that later travelled under its name.
1. Curves through the price, 2014 to 2019
The oldest of these drawings is a picture. On August 24, 2014, the Reddit user azop posted “Bitcoin price with over/under-valued bands” to r/Bitcoin: the logarithm of the price, a line of best fit through it, and colored bands of equal width on either side. In the comments he gave the slope, an average rise of about 0.59% a day, and called the bands “essentially arbitrary.” A straight line on a log chart means steady exponential growth, and he did not oversell it.
azop (r/Bitcoin comment, August 2014)Do not buy bitcoin simply because one chart (almost) tells you to at the moment.
Two months later, on October 22, 2014, Trolololo opened a BitcoinTalk thread titled “Logarithmic (non-linear) regression - Bitcoin estimated value.” Bitcoin was at $381. His chart, made in Excel and dated October 14, bent the line: the logarithm of the price rises with the natural logarithm of the days since January 9, 2009, so the curve keeps climbing but flattens. The formula sat in a calculator link under the chart, 10^(2.9065 × ln(days) − 19.493), and a table beneath it gave the day the curve would cross each power of ten: $1,000 on April 24, 2015, $10,000 on November 22, 2017, $100,000 on July 16, 2021, $1,000,000 on September 6, 2026. When a reader asked what the curve gave for 2075, he answered with the caveat that belongs to every model on this page.
Trolololo (BitcoinTalk post, October 23, 2014, 12:33:05 AM UTC)This logarithmic regression is way better than the linear regression. But it’s just a model, not a crystal ball.
He later rewrote the thread’s opening post to show only his newest chart. The 2014 version survives in the fourth post, in the chart image itself, which carries the formula and the July 2021 date, and in a reply from the next morning that he never edited.
The name “power law” came through Reddit. On September 3, 2018, u/Econophysicist1 posted “Bitcoin power law, over 10 year period, all the way to Genesis Block.” The account described itself as the CEO of Quantonomy, an algorithmic trading firm whose site names Giovanni Santostasi as its CEO. A year later, on September 4, 2019, Harold Christopher Burger published “Bitcoin’s natural long-term power-law corridor of growth” on Medium. He cited that Reddit post as earlier work and wrote down the numbers: a regression of the base-10 logarithm of the price on the logarithm of the days since 2009, with intercept −17.01593313 and slope 5.84509376, and a second line through the bubble tops with slope 5.02927337. His conclusions came as ranges.
Harold Christopher Burger (Medium article, September 4, 2019)the price will reach $100 000 per bitcoin no earlier than 2021 and no later than 2028. After 2028, the price will never drop below $100 000.
The rainbow chart on Blockchaincenter joins the two 2014 drawings. Its maker, who posts on X as Rohmeo, writes in his history of the chart that azop was “the original inventor” and that he himself “posted the first live version of the Bitcoin Rainbow Chart on 2019-05-19 on Reddit (as a straight line),” then swapped the straight line for Trolololo’s curve. After the price fell through the bottom band in 2022, he published a second version on November 21, 2022. The rainbow chart contains no dates. It is a set of colors around a line, and when the price left the colors, the colors were redrawn.
2. The model that wrote down dates
PlanB’s stock-to-flow model, published on March 22, 2019 as “Modeling Bitcoin’s Value with Scarcity,” starts from a ratio: the coins already in existence divided by the coins mined in a year. The ratio jumps at every halving. He fit 111 monthly points from December 2009 to February 2019 and printed the formula as ln(market value) = 3.3 × ln(SF) + 14.6. That is a formula for the total market value, not for the price of one coin, and the article says the price version has “different parameters” without giving them. The prediction came with a window: “we will probably know one or two years after the halving, in 2020 or 2021.”
PlanB (Medium article, March 22, 2019)The predicted market value for bitcoin after May 2020 halving is $1trn, which translates in a bitcoin price of $55,000
Bitcoin was at $3,984 that day. It first closed above $55,000 on February 19, 2021. Measured by the terms it set for itself, the 2019 prediction arrived inside its window. A year after it, on April 27, 2020, PlanB took time out of the model altogether. “Bitcoin Stock-to-Flow Cross Asset Model” fit six points, four phases of Bitcoin plus silver and gold, and put the 2020–2024 phase at a market value of $5.5 trillion, a price of $288,000. He flagged it himself as “a first step that has not yet been replicated and reviewed by others.” Between the 2020 and 2024 halvings, the highest daily price was $73,082, on March 13, 2024.
Then, on June 20, 2021, with Bitcoin below $34,000, he posted month-by-month numbers for the rest of the year and called them his “worst case scenario.” The chart attached to the post was titled “Bitcoin S2F Model - Worst Case Scenario 2021.” Five months later he gave the same numbers another name.
PlanB (tweet, November 25, 2021, 12:38:56 PM UTC)Floor model $98K Nov close will probably be a first miss (after nailing Aug, Sep, Oct). S2F model not affected and indeed on track towards $100K.
| Month (2021) | Floor PlanB posted on June 20 | Closing price |
|---|---|---|
| August | above $47K | $47,219 |
| September | above $43K | $43,781 |
| October | above $63K | $61,432 |
| November | above $98K | $57,097 |
| December | above $135K | $46,355 |
The closing price is CoinMetrics’ daily reference price for the last day of each month. October closed $1,568 under its floor, and PlanB still counted it as nailed. That is a small thing beside what the table does to the names. In June these numbers were the worst case on a chart that carried the S2F name. In November they belonged to a floor model, and their miss left stock-to-flow “not affected.” On December 24 the floor model was declared a failure, the $100K test was withdrawn, and stock-to-flow was given a band to stay in for two and a half years. The next day he wrote, “Imagine thinking a model that has stayed within 1 standard deviation band for 3yrs has failed.”
The window he set ran to June 2024. Six months into it, on June 18, 2022, Bitcoin’s reference price was $19,014, far under the band he had described in December as “roughly $50K-$200K.” Two days later he posted the original 2019 model beside a new fit.
PlanB (tweet, June 20, 2022, 4:56:03 PM UTC)S2F model certainly had a good run from Mar2019 (BTC 4K) to Mar2022 (BTC 45K). For now: either BTC is extremely undervalued and will bounce back soon, or S2F will be less useful in the future
Only two promises on this page put a price on a named day: Trolololo’s table and PlanB’s posts. That is what makes them the two that can be seen to miss, and PlanB’s is the one that was rewritten when its day came. A test that moves after it fails stops measuring the model. From December 24 on, stock-to-flow could no longer fail on a date, and when the price left the band as well, the word PlanB chose was “less useful,” not “wrong.”
3. Price as a function of the network
Not every model draws the price against time. On March 30, 2014, u/gsantostasi posted “Bitcoin compared with Metcalfe’s and Zipf’s law” to r/Bitcoin. In the comments he fit the number of addresses to a logistic curve, regressed the price on the number of users with both on log scales, and found a power of 1.45, between Metcalfe’s square and Zipf’s law. He was plain about what he was not doing: “Notice I do not use the price as a function of time to predict anything.”
Timothy Peterson of Cane Island Alternative Advisors took the same idea to a journal. “Metcalfe’s Law as a Model for Bitcoin’s Value,” posted to SSRN on December 2, 2017 and published in Alternative Investment Analyst Review in the second quarter of 2018, models the value as proportional to the square of the number of users, handles new issuance with a Gompertz curve, and uses the fit to test claims that the price was manipulated in 2013 and 2014. Its abstract sets no date and no price.
Ten years after his Reddit post, Santostasi tied the two kinds together. “The Bitcoin Power Law Theory,” published on Medium on March 20, 2024, argues that users grow as the cube of time and the price as roughly the square of users, so the price goes as time to the sixth power. The essay gives no fitted coefficients. It gives a horizon instead, about ten years to $1 million, and a limit: the theory “should not be used to make predictions beyond 2040 at most.” Of stock-to-flow it says, “Basically, it is nonsense,” and of the idea underneath it:
Giovanni Santostasi (Medium essay, March 20, 2024)Scarcity plays absolutely no role in this theory
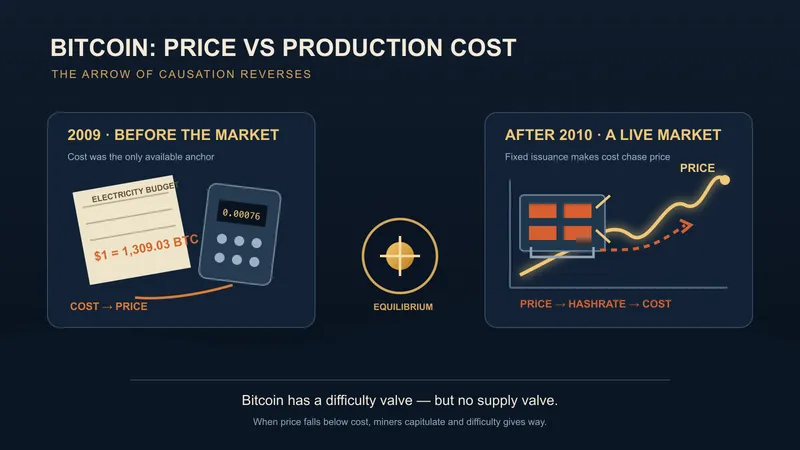
A third family prices the coin from what it costs to mine. That argument is older than every chart on this page, and its record runs from the first exchange rate in October 2009 to the mining-cost studies of the 2020s, traced in the analysis of Bitcoin’s price and its production cost.
4. What each kind of model can be held to
| Model | Author, date | Kind of promise | Original formula | What the author wrote down | Against the daily price |
|---|---|---|---|---|---|
| Bands on log price | azop, 2014-08-24 | Corridor without dates | Straight line, about 0.59% a day | No date or price | Nothing to measure |
| Logarithmic regression | Trolololo, 2014-10-22 | Curve with arrival dates | 10^(2.9065 ln d − 19.493), d = days since 2009-01-09 | $100K on 2021-07-16, $1M on 2026-09-06 | $31,456 on 2021-07-16, $80,320 on 2026-09-06 |
| Stock-to-flow | PlanB, 2019-03-22 | Dated target, as market value | ln(MV) = 3.3 ln(SF) + 14.6 | $55,000 after the May 2020 halving, “in 2020 or 2021” | First close above $55,000 on 2021-02-19 |
| Power-law corridor | Burger, 2019-09-04 | Corridor with a date range | log10 P = −17.01593313 + 5.84509376 log10 d | $100K no earlier than 2021, no later than 2028 | First close above $100K on 2024-12-08 |
| S2FX | PlanB, 2020-04-27 | Target for a period | MV = exp(12.7598) × SF^4.1167 | $288K in 2020–2024 | Highest close $73,082, on 2024-03-13 |
| Worst case, then floor model | PlanB, 2021-06-20 | Monthly floors | Not published | Above $47K in August to above $135K in December | Two of five months above |
| One-standard-deviation band | PlanB, 2021-12-24 | Band over a window | Roughly $50K–$200K in December 2021 | Stay in the band to June 2024 | $19,014 on 2022-06-18 |
| Power law theory | Santostasi, 2024-03-20 | Horizon | Price as time to the sixth power, no coefficients | About ten years to $1M | Not yet measurable |
Trolololo’s table is the easiest of these to hold against the record, because it names four days.
| Price | Trolololo’s date | Price on that date | First daily close at or above |
|---|---|---|---|
| $1,000 | 2015-04-24 | $231 | 2017-01-02 |
| $10,000 | 2017-11-22 | $8,250 | 2017-12-01 |
| $100,000 | 2021-07-16 | $31,456 | 2024-12-08 |
| $1,000,000 | 2026-09-06 | $80,320 | Not yet |
A curve fit in 2014 met one of its four dates within nine days, and it missed by more at each power of ten after that. Burger’s corridor, fit five years later on more of the same history, put $100,000 inside an eight-year range, and the price arrived in the fourth year. A range that wide is easy to land in. That is what a range is for, and what it costs. His second sentence, that the price will never drop below $100,000 after 2028, cannot be tested yet. Since December 8, 2024 the price has closed below $100,000 on 465 days, the latest of them October 21, 2026, at $84,176.
5. Whose formula
The formulas travel without their authors. The rainbow chart credits azop with the bands and quotes Trolololo’s formula as y=2.9065ln(x)-19.493. Santostasi’s 2024 essay contains no coefficients at all. The Japanese page of the chart site bitbo, titled “Bitcoin long-term power law” in Japanese, gives A = 10^-17.016 and n = 5.845 counted from January 3, 2009, repeats Burger’s two conclusions almost word for word ($100,000 between 2021 and 2028, $1,000,000 between 2028 and 2037), and credits the model to Santostasi alone, without Burger’s name. Burger’s own article names the Reddit post that came before him. Here the man who wrote the numbers down cited his source, and the source got the numbers.
On September 6, 2026, the day Trolololo’s 2014 table gave for $1,000,000, Bitcoin closed at $80,320. He had recalculated his curve long before, as he said he would; the 2017 version of his opening post links a formula with different constants. The 2014 table is still in the thread, though, a date under each number, and anyone can hold it against the day without asking him what he meant. That table missed. I trust it more than the model that, once its December came, was told to wait in a band. A prediction is worth something on the day it can be wrong.