Bitcoin Institute

"Imagine thinking a model that has stayed within 1 standard deviation band for 3yrs has failed" (@100trillionUSD, 2021-12-25)

Figures: PlanB
PlanB @100trillionUSD December 25, 2021 11:42 UTC

Imagine thinking a model that has stayed within 1 standard deviation band for 3yrs has failed. IMO we are in the exact same spot as March 2019 when I published S2F model: at the low end of the 1sd band. DYOR. Look at the chart. Your choice. pic.twitter.com/b9ebjY886k
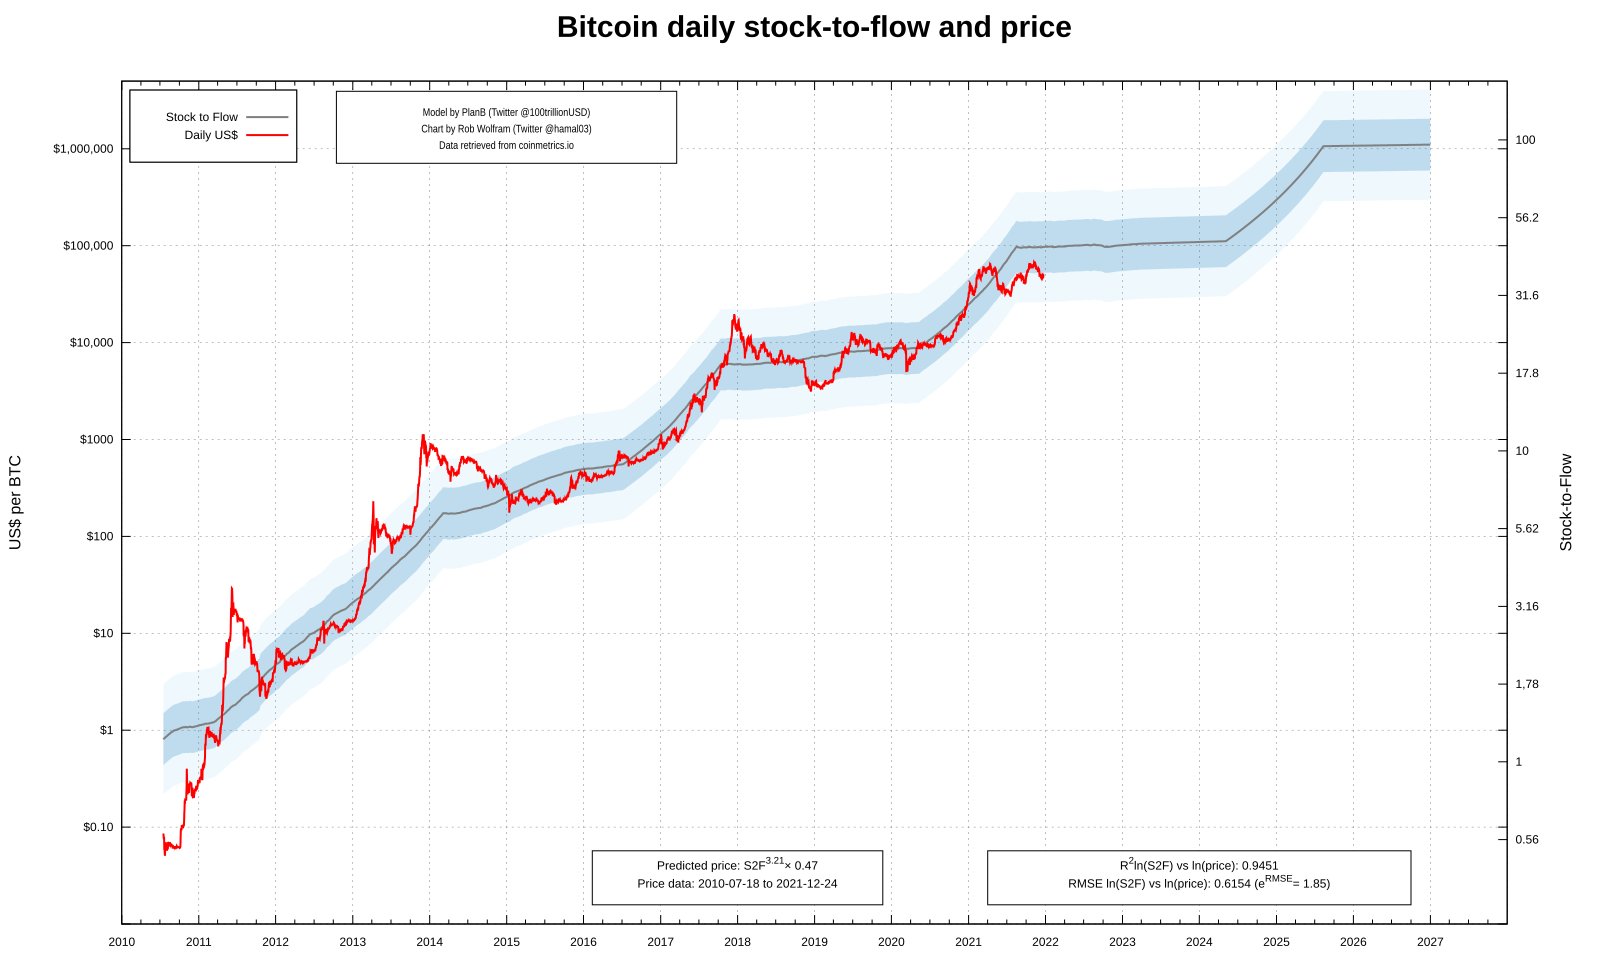
The same "Bitcoin daily stock-to-flow and price" chart, credited "Model by PlanB, Chart by Rob Wolfram," with price data through 2021-12-24: the red price line at the lower edge of the light-blue bands at the end of 2021

Original external source

https://x.com/100trillionUSD/status/1474707018447532037
Text from X's official embed (publish.twitter.com/oembed); the posting time and the attached image from X's embed data (cdn.syndication.twimg.com), both retrieved October 22, 2026.