
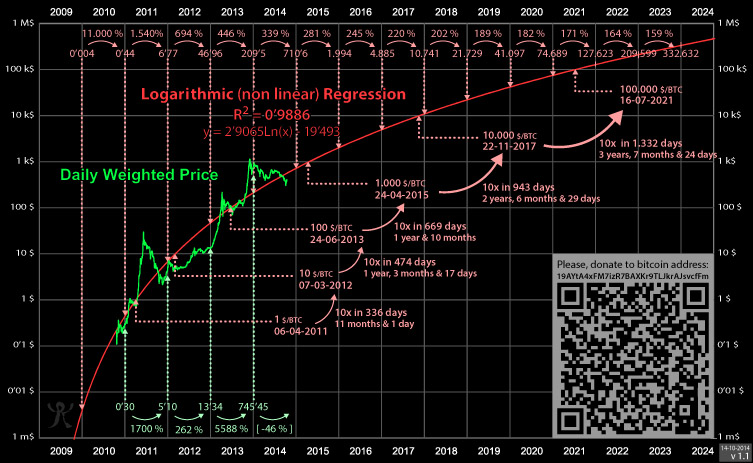
Chart with data until 2014-10-14:
Donations: 19AYtA4xFM7izR7BAXKr9TLJkrAJsvcfFm
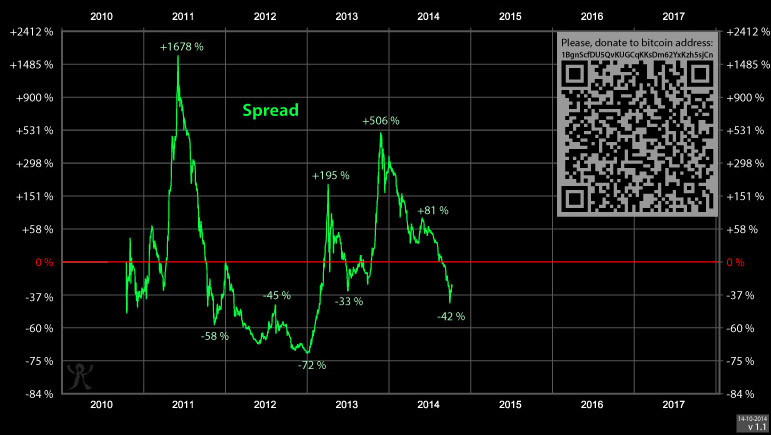
If we “flatten” the red logarithmic line, we get the spread between the price and the estimated value:
Donations: 1BgnScfDU5QvKUGCqKKsDm62YxKzh5sjCn
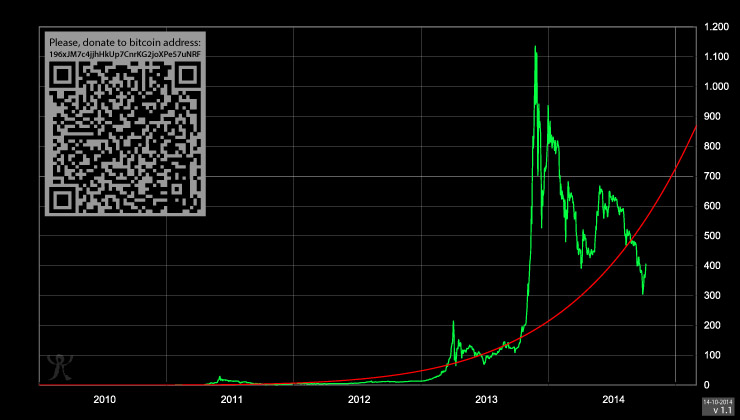
This is how the 2011 and 2013 (1) bubbles look like in linear price axis:
Donations: 1EbbkBkTDZ667bUxHNHtxhAysFEAWVgWB4
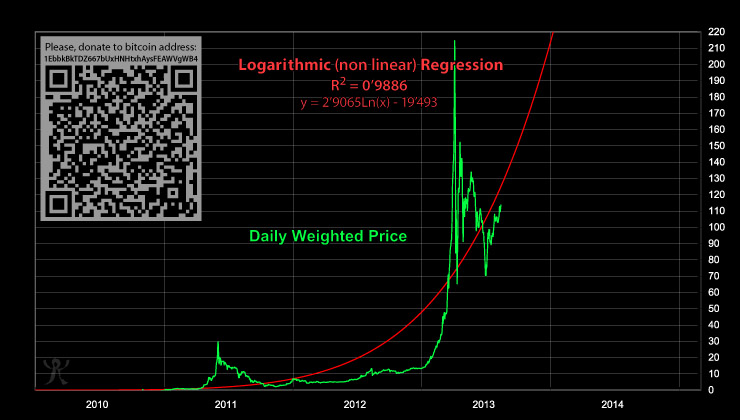
And this is how the 2011 and 2013 (1&2) bubbles look like in linear price axis:
Donations: 196xJM7c4jjhHkUp7CnrKG2joXPe57uNRF
Calculate today’s trendline price HERE (http://www.wolframalpha.com/input/?i=10%5E%282.9065++*+ln%28%28number+of+days+since+2009+Jan+09%29%2Fdays%29+-+19.493%29)
Projected:
     1.000  24-04-2015
    10.000  22-11-2017
   100.000  16-07-2021
 1.000.000  06-09-2026