Logarithmic (non-linear) regression - Bitcoin estimated value

In this OP I will always post the last updated chart:
Update 2017-01-03:
Donations: bitcoin:1Fe6B3Zo4HxaCD8ybi9A8zBRH2wKpciUxe
Calculate today’s trendline value HERE (http://www.wolframalpha.com/input/?i=10%5E(2.66167155005961++*+ln((number+of+days+since+2009+Jan+09)%2Fdays)+-+17.9183761889864))
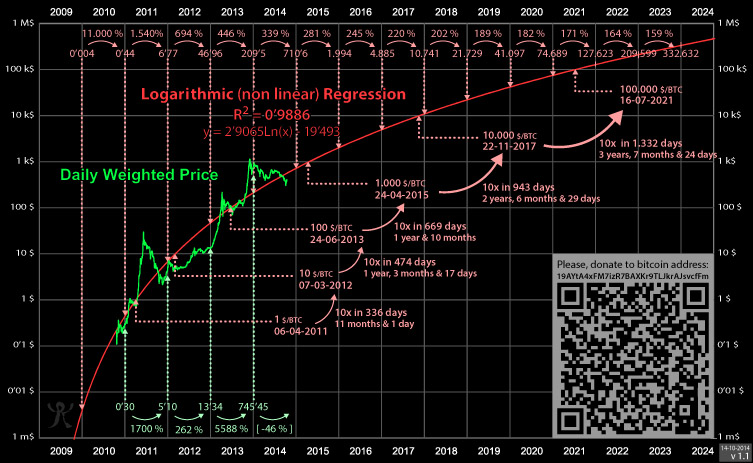
Chart with data until 2014-10-14:
Donations: 19AYtA4xFM7izR7BAXKr9TLJkrAJsvcfFm
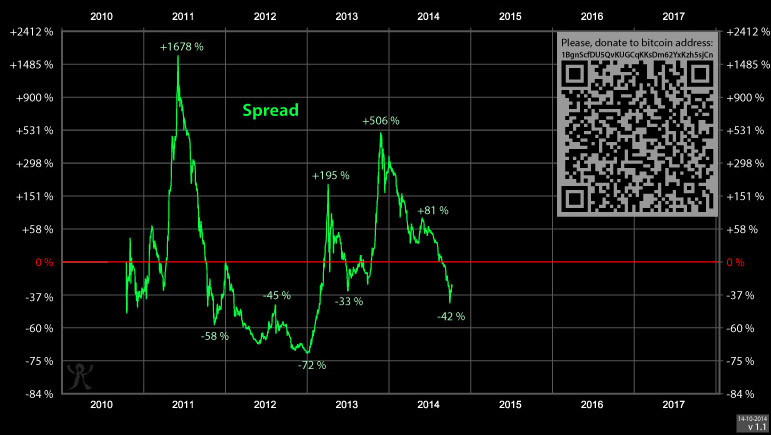
If we “flatten” the red logarithmic line, we get the spread between the price and the estimated value:
Donations: 1BgnScfDU5QvKUGCqKKsDm62YxKzh5sjCn
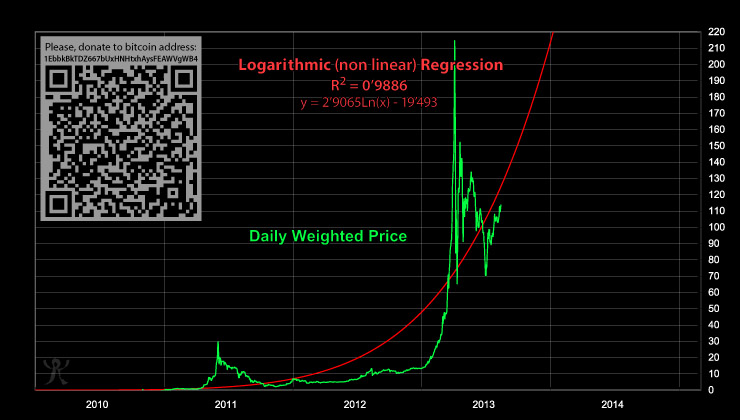
This is how the 2011 and 2013 (1) bubbles look like in linear price axis:
Donations: 1EbbkBkTDZ667bUxHNHtxhAysFEAWVgWB4
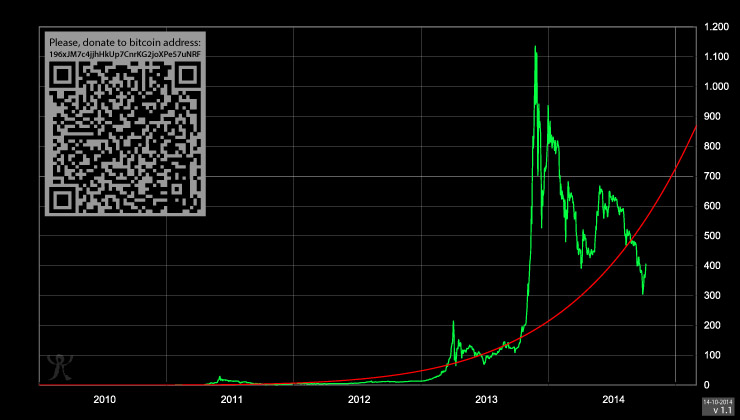
And this is how the 2011 and 2013 (1&2) bubbles look like in linear price axis:
Donations: 196xJM7c4jjhHkUp7CnrKG2joXPe57uNRF
Calculate today’s trendline price HERE (http://www.wolframalpha.com/input/?i=10%5E%282.9065++*+ln%28%28number+of+days+since+2009+Jan+09%29%2Fdays%29+-+19.493%29)
Projected:
     1.000  24-04-2015
    10.000  22-11-2017
   100.000  16-07-2021
1.000.000 06-09-2026Quote from: chriswilmer on October 23, 2014, 12:14:23 AM
What price do you get in 2075? In my opinion the “equilibrium” price of Bitcoin is one of the easier numbers to make rational arguments about (thermodynamics is always on sounder footing than kinetics, etc.). For example, if you get $1 trillion per BTC in 2075, I would say the model is problematic, however well fitted. If you get something in the $1-10 million range, then you’re probably in the ballpark. (these models assume a certain optimism about adoption already)
By year 2075 I will be dead.
The curve will always grow, but slowlier and slowlier as time goes by. Just like the Bitcoin emission curve. This logarithmic regression is way better than the linear regression. But it’s just a model, not a crystal ball.
The curve will flatten or steepen depending on the future price fluctuations, but not much. I will recalculate the regression from time to time. Maybe monthly, or once every three or four months.
I made the chart for myself, and I later thought that it would be worth sharing it with you all.
Added to the OP:
Calculate today’s trendline price HERE (http://www.wolframalpha.com/input/?i=10%5E%282.9065++*+ln%28%28number+of+days+since+2009+Jan+09%29%2Fdays%29+-+19.493%29)