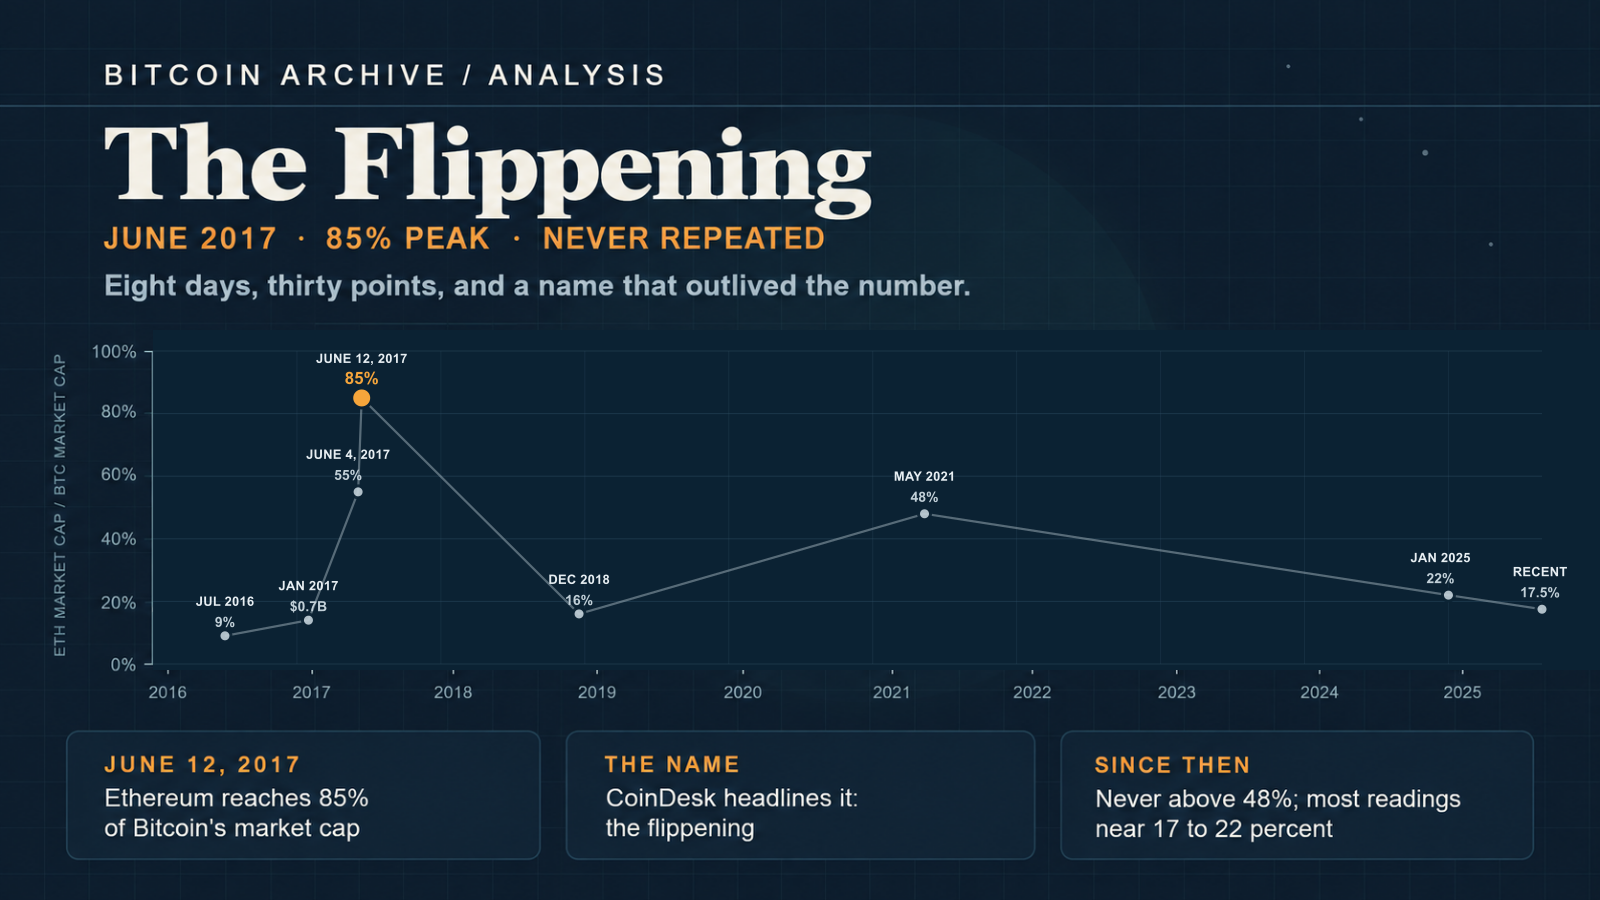
On June 4, 2017, Ethereum’s market capitalization stood at about 55% of Bitcoin’s. Eight days later, on June 12, CoinMarketCap’s snapshot put the two side by side at $37.11 billion against $43.59 billion — about 85%. CoinDesk ran the story the next morning under the headline “The #Flippening: Will Ether Pass Bitcoin?” — the hashtag in the headline treats the name as already in circulation, not as something the article was coining on the spot.
1. What “the flippening” actually named
“The flippening” is the name for a prediction: that the market capitalization of Ethereum — the chain Vitalik Buterin launched in 2015 — would overtake Bitcoin’s and make it the largest cryptocurrency. In 2017, the ratio’s climb to 85% made that prediction look close to coming true. CoinDesk’s June 13 report canvassed executives on both sides:
| Speaker | Affiliation | Position |
|---|---|---|
| Marius Rupsys | InvoicePool | Ethereum already benefiting from Bitcoin’s unresolved scaling dispute |
| Charles Hayter | CryptoCompare | Ethereum’s network effect gives it “a strong chance of surpassing bitcoin” |
| Petar Zivkovski | Whaleclub (chief operating officer) | Ether “incredibly overpriced”; many 2017 ICOs would “not deliver on all their promises” |
The 85% reading was the single data point that made that overtake look close to real. Ethereum has never actually overtaken Bitcoin’s market capitalization.
2. How fast the eight days moved
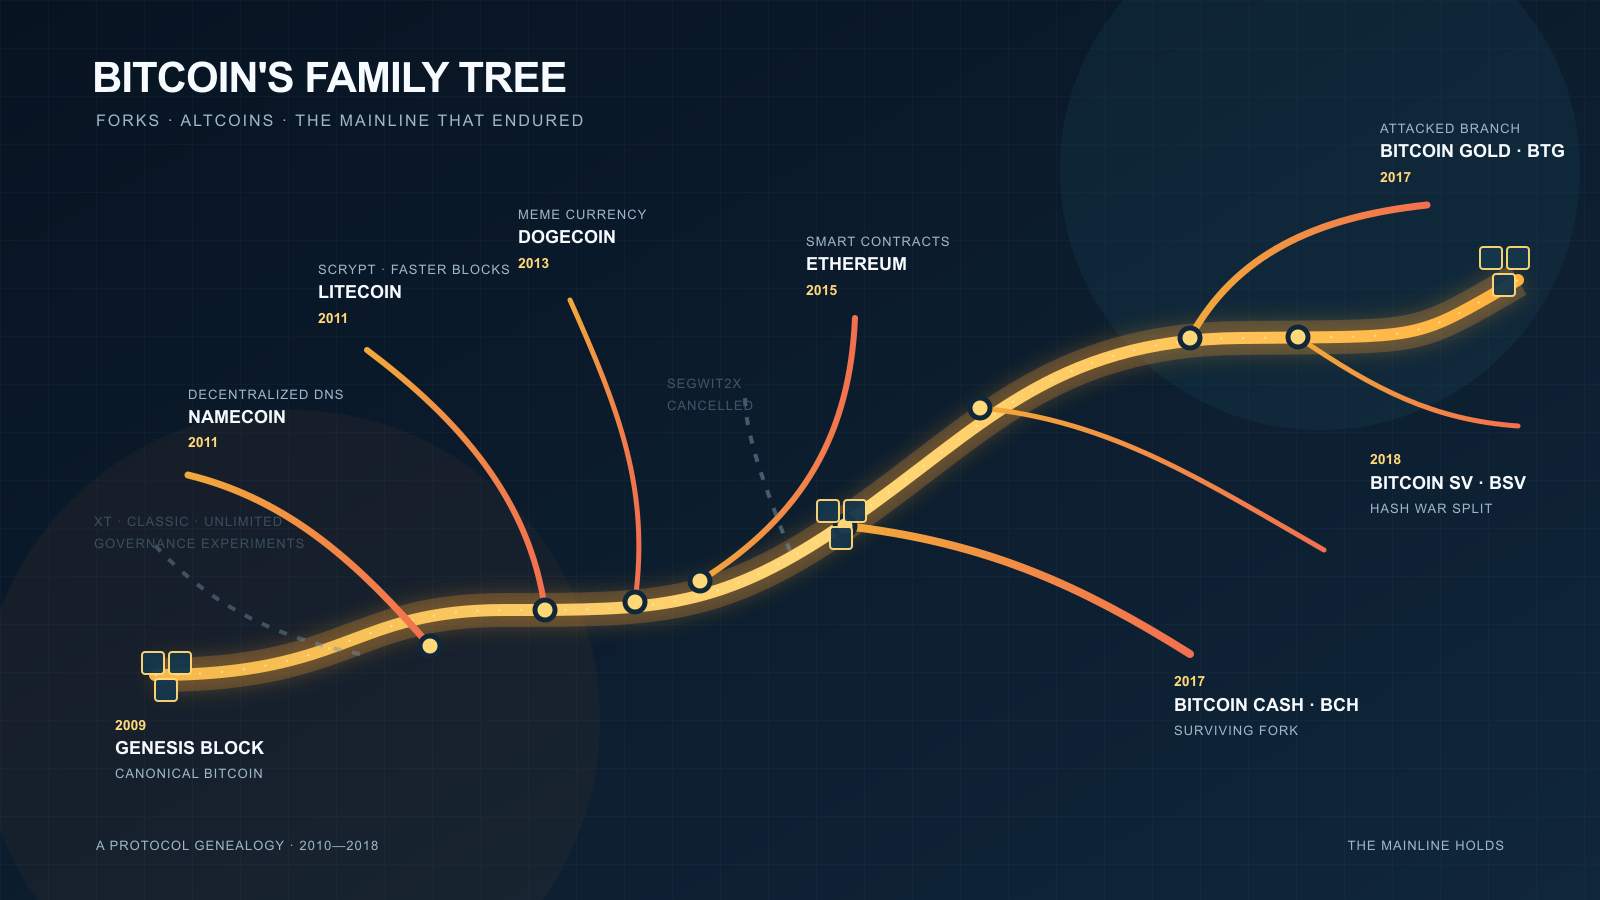
The eight days between the two CoinMarketCap snapshots above show more than the peak figure alone does: the ratio did not drift up to 85%, it jumped there. A reading near 55% on June 4 reached 85% by June 12 — roughly thirty percentage points in a little over a week, inside a broader 2017 run that took Ethereum’s market capitalization from under $1 billion on January 1 to $37.11 billion by June 12, a fifty-fold rise in five months. The fork-and-altcoin genealogy analysis plots the same two chains once a year, every June 1 — a sampling frequency built to show fifteen years of lineage, not an eight-day swing. Set against that yearly cadence, the ratio above is the one week the yearly chart cannot show.
3. What the record shows after June 12
Of the later CoinMarketCap snapshots this entry cites, none shows Ethereum’s market capitalization reaching 85% of Bitcoin’s again. By December 15, 2018, both chains had fallen far below their 2017 highs, and the ratio itself had fallen further still, to about 16% ($8.8 billion against $56.4 billion). By May 12, 2021 — during a bull run that took both chains to dollar valuations an order of magnitude above 2017 — the ratio recovered only to about 48% ($438.6 billion against $919.5 billion), still well short of the 2017 peak. By January 1, 2025 it stood at about 22%. At the figures consulted when this entry was last revised, the ratio was near 17.5% — lower than the 85% of June 12, 2017, at every one of these later dates.
4. What the record shows around the Merge
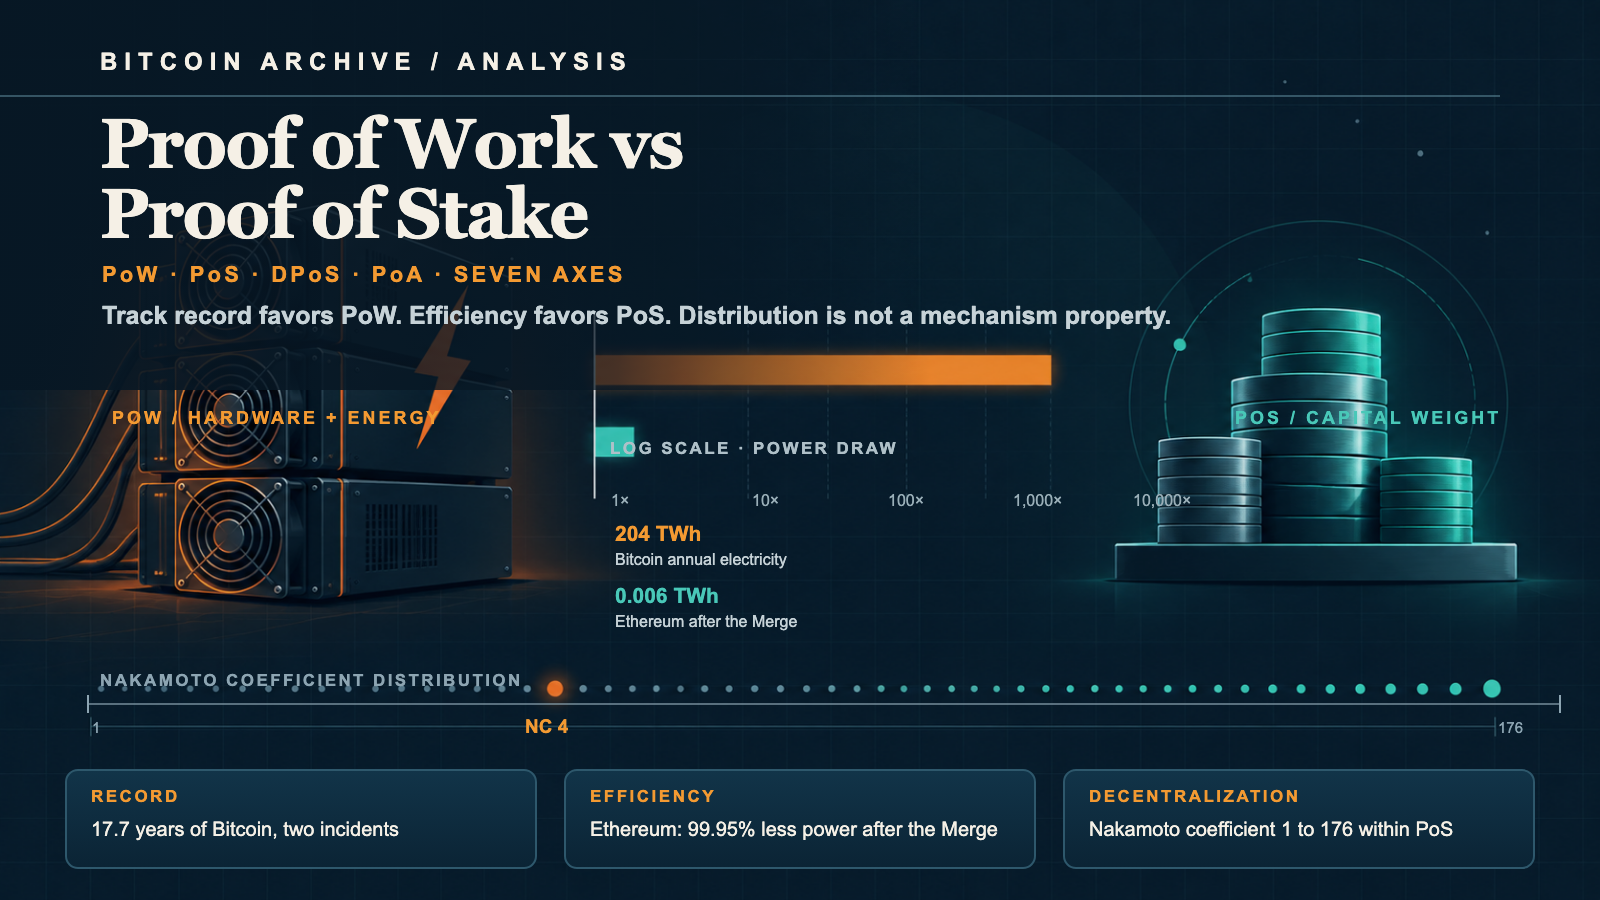
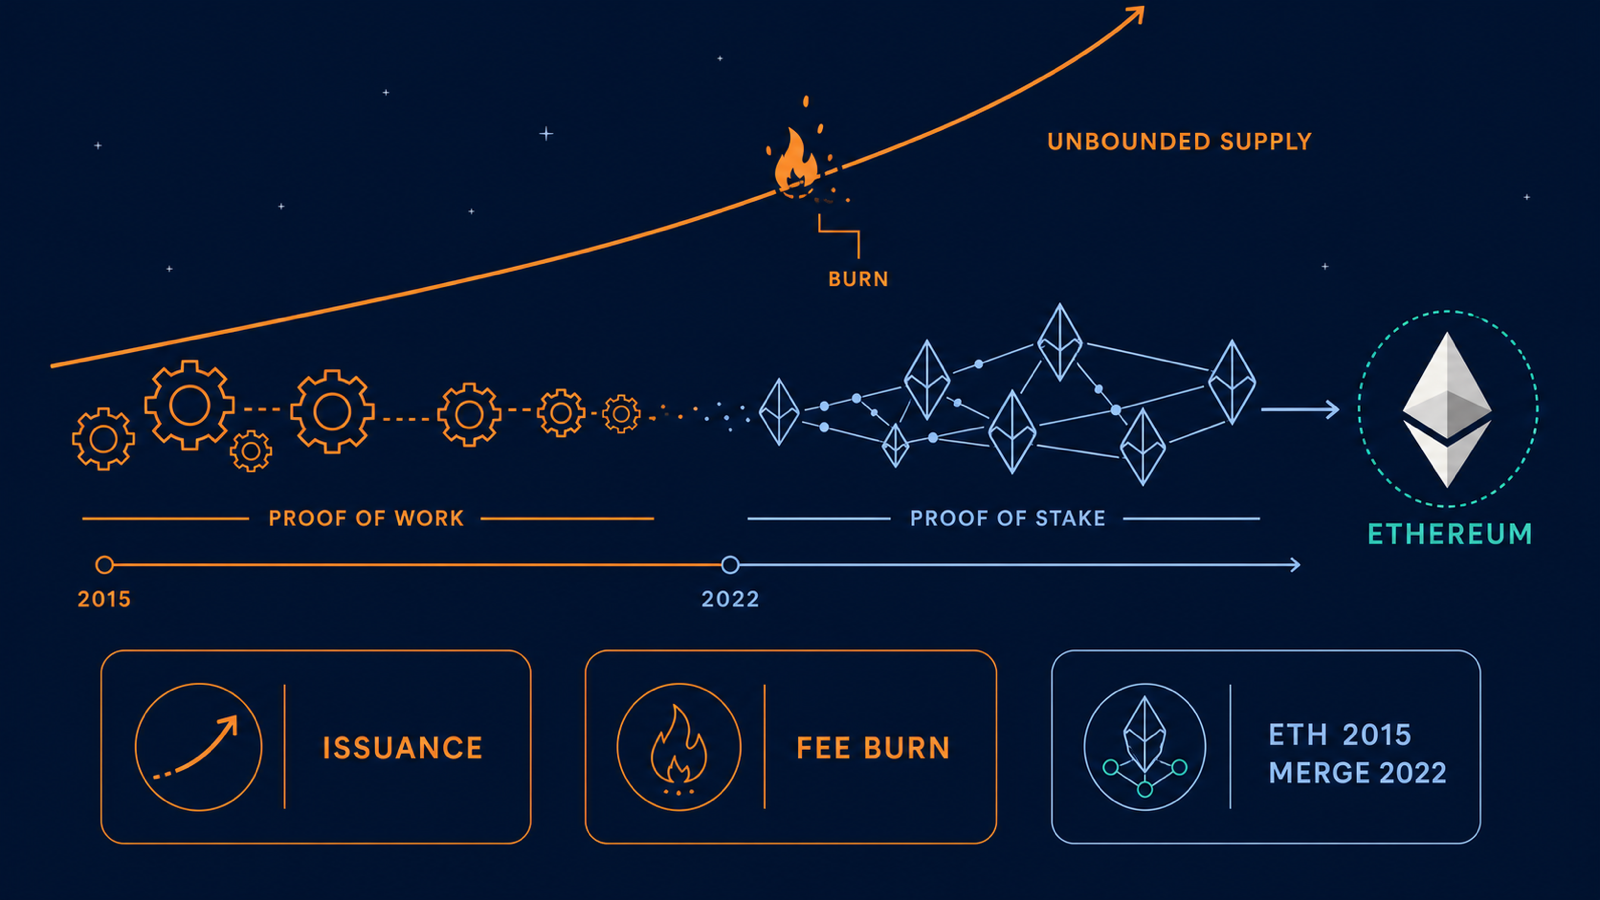
In June 2017, when the ratio reached 85%, Ethereum ran on proof of work, with miners producing the blocks. On September 15, 2022, the Merge switched it to proof of stake: validators who had staked ETH took over from the miners the job of validating blocks. Did the switch thin out the buyers and stall the market cap? CoinMarketCap’s dated snapshots from either side of it are set out below (volume is the 24-hour figure). What the two mechanisms measure like on every other axis, from electricity to finality, is the subject of the proof-of-work versus proof-of-stake comparison.
| Date | Ethereum market cap | Bitcoin market cap | Ethereum volume | Bitcoin volume |
|---|---|---|---|---|
| Nov 8, 2021 | $569.1bn | $1,274.8bn | $19.3bn | $41.1bn |
| Sept 14, 2022 (day before the Merge) | $200.0bn | $387.6bn | $17.9bn | $37.9bn |
| Sept 16, 2022 (day after) | $175.3bn | $378.7bn | $16.8bn | $30.1bn |
| Oct 15, 2022 | $156.6bn | $365.7bn | $6.8bn | $16.2bn |
| Jan 1, 2023 | $147.0bn | $320.0bn | $2.4bn | $9.2bn |
| Jan 9, 2024 | $281.8bn | $904.1bn | $14.9bn | $39.8bn |
The market-cap share stood at 51.6% the day before the Merge, above the 44.6% of November 2021. It fell to 46.3% the day after and 42.8% a month later, then recovered to 45.9% on January 1, 2023. The drop to 31.2% came on January 9, 2024, about sixteen months after the Merge and the day before spot bitcoin ETFs were approved in the United States.
Between the day before the Merge and the day after, Ethereum’s 24-hour volume dropped 6% and Bitcoin’s 20%; by January 1, 2023, the drops were 87% and 76%. The larger fall switched sides along the way, and each figure is a single day’s, so the gap cannot be read as an effect of the Merge.
On September 5, 2024, The Block reported a CryptoQuant analysis: since the Merge, ether had underperformed bitcoin by 44%. It named three factors. The first was weaker network activity than Bitcoin’s, with lower fees after the Dencun upgrade and a falling transaction count given as examples. The second was a growing ether supply. The third was a preference among traders and investors for more exposure to bitcoin than to ether. The article uses the switch to proof of stake only to mark where the measured period begins, and does not list it among the causes.
What the record shows is a market-cap share that fell after the Merge, to 31.2% by January 2024, and a 2024 analysis describing investors who preferred bitcoin to ether. It holds nothing that supports a yes to the opening question, that the move to proof of stake cut the number of buyers and stopped the market cap from rising. The factors the article names do not include the switch itself, and nothing here separates out the effect of the switch alone. The ratio had also stayed far from 85% before the Merge: the 16% of December 2018 and the 51.6% of the day before the Merge are both proof-of-work readings.
5. What the number does and does not settle
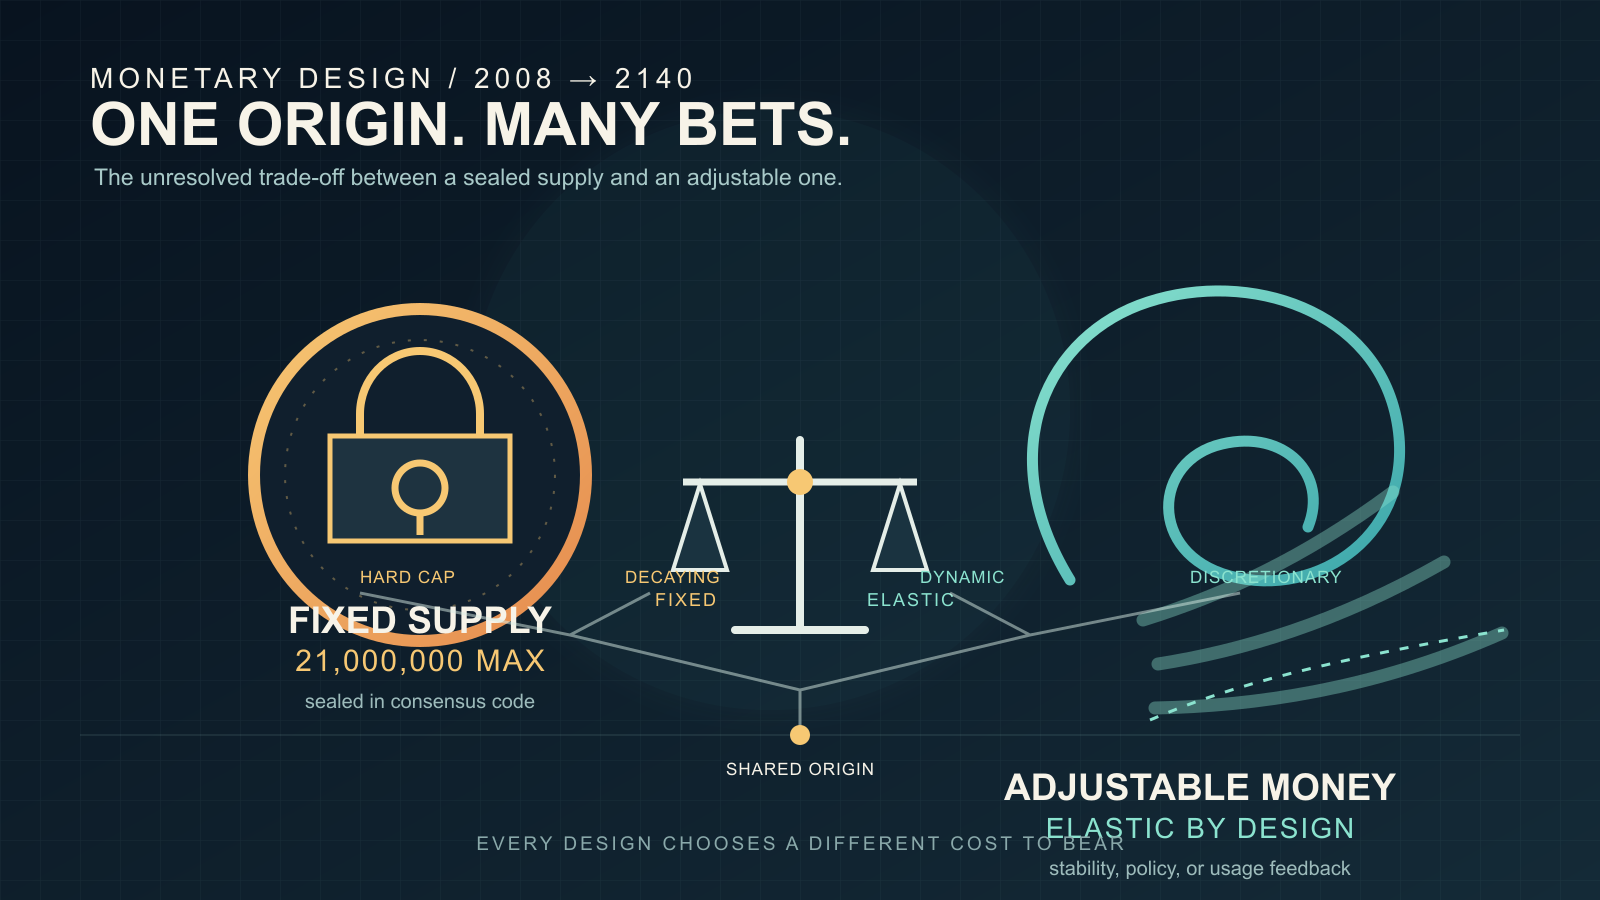
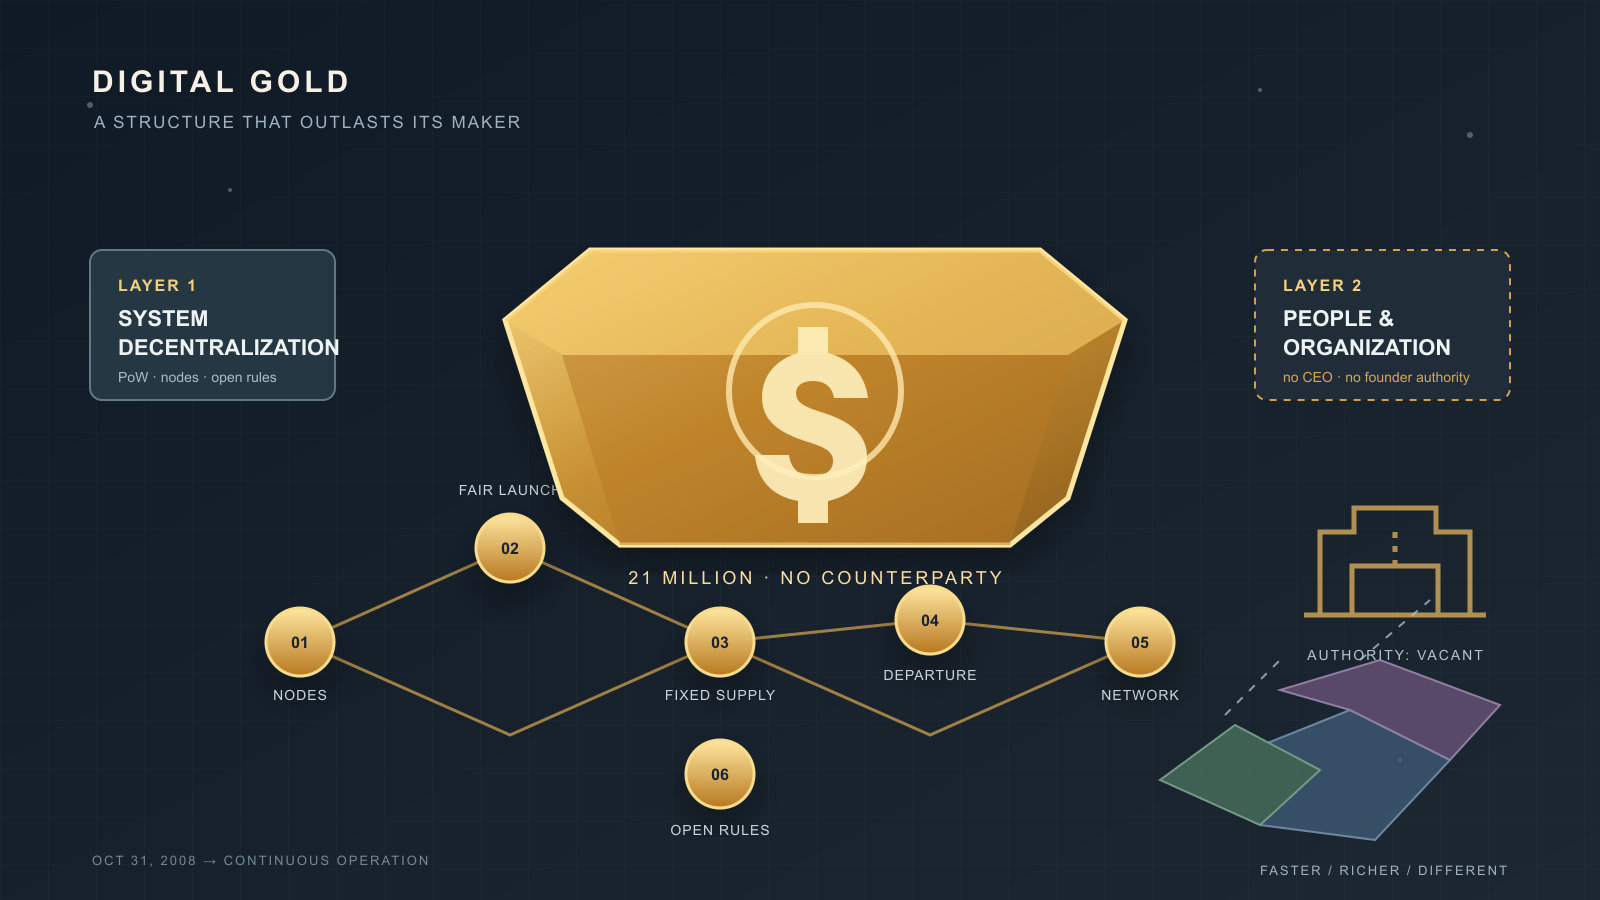
The 85% reading is a ratio of two market capitalizations, and market capitalization moves on regulation, institutional flows, the arrival of listed products, and the total flow of money into the asset class that period — not on any single chain’s design. June 2017 sits early in both chains’ history: before Ethereum’s EIP-1559 fee burn (August 2021), before the Merge (September 2022), and years before either chain reached the valuations of 2021 or 2025. The fixed-supply-vs-adjustable-money analysis sets this same pair of snapshots beside Bitcoin’s fixed 21-million cap and Ethereum’s usage-linked issuance, and its conclusion carries over directly: the series is not a scorecard on which monetary design the market prefers. June 12, 2017 also marks the closest any chain has come to displacing the digital-gold slot Bitcoin has held since 2009 by that measure. What the date fixes is narrower and more specific — a single named prediction, at its single closest recorded approach, nine years before this entry was last revised.
I keep coming back to how little separates “the flippening” from every other altcoin prediction this archive has set aside without a second look. Most of those never had a number attached to them. This one did, for eight days in June 2017, and the number was real — a dated snapshot, not a rumor. What I can’t find anywhere in the record is a second week that came as close. The name outlived the number by years; the number itself never came back.